Manage and analyze your posts
Print
Modified on: Tue, 28 Jul, 2020 at 4:17 PM
Content on Social Elephants is organized in 2 columns:
On the left side there is a representation of the post as it can be found in the social networks, with its social counters (interactions), an external link to visit the original post and options to hide/delete the posts. Below the profile picture there is an icon referring to the type of format (photo, link, video, etc.).
On the right side of each post we display the Key Performance indicators, references to existing content TAGs and private Notes.

Hovering over the side box, some action buttons are revealed:
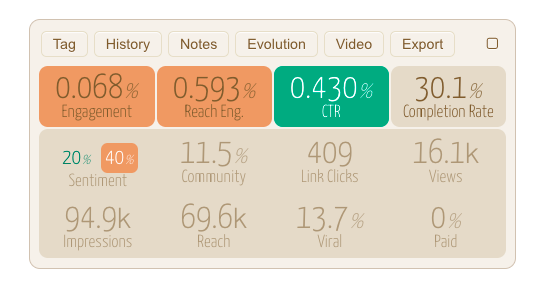
TAG: to manage the TAGs and manually edit the Sentiment associated to the post.
HISTORY: to access to a log of relevant actions performed by users (composing, reviewing, scheduling, etc.)
NOTES: to read or add internal notes associated to the post.
EVOLUTION: to access to detailed analysis of all the metrics of the post since the day of publication.
VIDEO: access to a specialized panel of metrics to analyze video performance
EXPORT: to export all the responses (comments or replies) to the post.
The selector on top right allows for bulk management of posts.
Some of the KPIs (top row) are eventually highlighted in RED or GREEN , when we detect a BAD or GOOD performance.
This performance "traffic light" indicator is relative to the recent average activity of the selected Social Profile, i.e. the last 30 days or 30 available data samples.

The EVOLUTION tab is particularly useful to explore all the available post metrics and monitor their evolution in the hours/days after the publication.
In the example below we can see the evolution of Reach Engagement of a post during a campaign of Facebook Ads: with the progress of the campaign the post gains Paid Impressions and suffers a dramatic decay of Reach Engagement.
Social Elephants helps you to understand when your content is underperforming and when you should consider to stop/edit your Social Ads campaign.

Did you find it helpful?
Yes
No
Send feedback Sorry we couldn't be helpful. Help us improve this article with your feedback.